Iklan

Search Engine

Custom Search
Showing posts with label feedbacks. Show all posts

Monday, May 16, 2016

Further Confirmation Of Arctic Sea Ice Dramatic Fall

Since early April, 2016, there have been problems with the sensor on the F-17 satellite that provided the data for many Arctic sea ice images. On April 12, NSIDC issued a notice that it had suspended the provision of sea ice updates. On May 6, NSIDC announced that it had completed the shift to another satellite. The red dotted line in the image below shows data from the F-18 satellite from April 1 to May 15, 2016.

The JAXA site also provides sea ice extent images, obtaining data from a Japanese satellite. They show that Arctic sea ice extent on May 15, 2016 was 11,262,361 square km, 1.11 million square km less than it was on May 15, 2012.


The Cryosphere Today is still using data from the F17 satellite, showing some weird spikes. Albert Kallio has taken a recent image and removed faulty spikes, resulting in the image below showing sea ice area up to May 3, 2016.

[ yellow line is 2016, red line is 2015 ]
Importantly, above image confirms that Arctic sea ice in 2016 has indeed been very low, if not at its lowest for the time of the year. Especially since April 2016, sea ice has fallen far below anything we've seen in earlier years. Below, Albert elaborates on comparing data.


by Albert Kallio

REPAIRED USA (F-17) SATELLITE DATA SHOWS RECORD SMALL SEA ICE AREA IN MAY 2016 AGREEING JAPANESE (JAXA) DATA

A corrected Special Sensor Microwave Imager and Sounder (SSMIS) data set on the Defense Meteorological Satellite Program (DMSP) F-17 satellite that provides passive microwave brightness temperatures (and derived Arctic and Antarctic sea ice products) has been corrected here for the system instrumentation error. This agrees with the Japanese JAXA curve, and has been accomplished by removal of the uncharacteristic upward 'ice growth' spikes by linear intrapolation of the corrupt data points. This reinforces the JAXA data that shows the Northern Hemisphere sea ice area is seasonally at new record low which has continued in May 2016.

Smoothened F-17 curve agrees with the Japanese JAXA satellite curve. The reconciliation of the two has been accomplished by removal of the uncharacteristic upward spikes by linear intrapolation of the corrupt days' data points which incorrectly showed immense sea ice area growth in the middle of spring melt season. This reinforces the JAXA data that shows the sea ice area is seasonally at record lows. Therefore, media who are citing recent F-17 satellite sea ice area figures are intentionally distorting the facts with their claims of the Northern Hemisphere having a record sea ice area for this time of season - whereas in reality - the exact opposite has been happening.


Arctic sea ice is in a bad shape and looks set to deteriorate even further, for a number of reasons.

The year 2016 is an El Niño year, as illustrated by the 51.1°C (124.1 °F) forecast for May 22, 2016, over the Indus Valley in Pakistan (see image right).

Insolation during the months June and July is higher in the Arctic than anywhere else on Earth. Greenhouse gases are at record high levels: CO2 was 408.2 ppm on May 12, 2016, and methane levels are high and rising, especially over the Arctic.

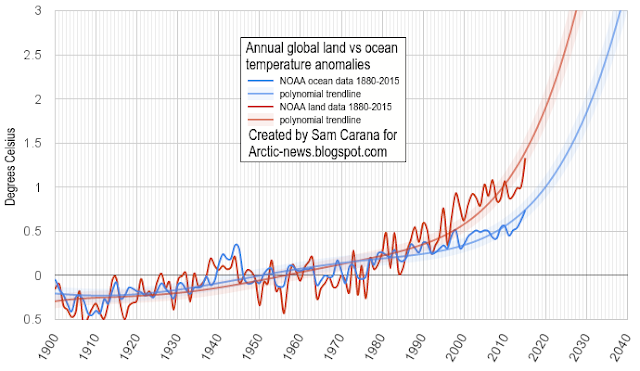
Ocean heat is also very high and rising. The image below shows that oceans on the Northern Hemisphere were 0.93°C (or 1.7°F) warmer in the most recent 12-months period (May 2015 through April 2016) than the 20th century average.


The situation is further illustrated by the image below, using the NOAA data with a trendline added that points at a rise of 3°C (5.4°F) before the year 2040.


Chances are that Arctic sea ice will be largely gone by September 2016. As the ice declines, ever more sunlight gets absorbed by the Arctic Ocean. This is one out of numerous feedbacks that are hitting the Arctic. The danger is that, as these feedbacks start to kick in more, heat will reach the seafloor of the Arctic Ocean and trigger methane to be released in huge quantities from the Arctic Ocean seabed.

Recently, an abrupt methane release from the Arctic Ocean seafloor did enter the atmosphere over the East Siberian Sea, showing up with levels as high as 2578 ppb (at 586 mb on May 15, 2016, pm, see image below). Such abrupt releases are indications that methane hydrates are destabilizing and are warnings that climate catastrophe is waiting to happen.


The situation is dire and calls for comprehensive and effective action as described in the Climate Plan.


Thursday, January 14, 2016

Greenhouse gas levels and temperatures keep rising

At the Paris Agreement, nations pledged to cut emissions and avoid dangerous temperature rises. Yet, the rise in greenhouse gas levels and temperatures appears to be accelerating.

Record growth of carbon dioxide levels at Mauna Loa

Annual mean carbon dioxide level measured at Mauna Loa, Hawaii, grew by 3.17 ppm (parts per million) in 2015, a higher growth rate than in any year since the record started in 1959.


As above image shows, a polynomial trendline added to the data points at a carbon dioxide growth rate of 4 ppm by the year 2024 and 5 ppm by the year 2028. 

At the start of the Industrial Revolution, the carbon dioxide level in the atmosphere was about 280 ppm. On January 11, 2016, as above image shows, carbon dioxide level at Mauna Loa, Hawaii, was 402.1 ppm. That's some 143% times what the upper level of carbon dioxide was in pre-industrial times over at least the past 400,000 years, as the image further below illustrates.

At higher northern latitudes, carbon dioxide levels are higher than elsewhere on Earth, as illustrated by above image. These high greenhouse gases contribute to accelerated warming of the Arctic. 

Methane levels rising even faster than CO2 levels, especially over Arctic Ocean

Historically, methane levels have been moving up and down between a window of 300 and 700 ppb. In modern times, methane levels have been rising even more rapidly than carbon dioxide levels, as illustrated by the image below, from an earlier post.

As above image illustrates, the mean level of 1839 ppb that was reached on September 7, 2014, is some 263% of the ~700 ppb that historically was methane's upper level.

The image below, from an earlier post, shows the available World Meteorological Organisation (WMO) annual means, i.e. from 1984 through to 2014, with added polynomial trendline based on these data. The square marks a high mean 2015 level, from NOAA's MetOp-2 satellite images, and it is added for comparison, so it does not influence the trendline, yet it does illustrate the direction of rise of methane levels and the threat that global mean methane levels will double well before the year 2040.


Recently, some very high peak levels have been recorded, including a reading of 2745 ppb on January 2, 2016, and a reading of 2963 ppb on January 8, 2016, shown below.


These high readings illustrate the danger that, as warmer water reaches the seafloor of the Arctic Ocean, it will increasingly destabilize sediments that can contain huge amounts of methane in the form of free gas and hydrates. Images associated with these high readings show the presence of high methane levels over the Arctic Ocean, indicating that these high peaks originate from the Arctic ocean and that sediments at the seafloor of the Arctic Ocean are destabilizing. The danger is that these peaks will be followed up by even stronger abrupt releases from the seafloor of the Arctic Ocean, as water temperatures keep rising.

Rising temperatures

Global mean temperature in 2015 was 0.87°C (~1.6°F) higher than in 1951-1980. 

Above image shows NASA data with a polynomial trendline added that points at a 2015 temperature that is more than 1.1°C (~2.03°F) higher than it was in 1900.

The image on the right shows that it was 1.17°C warmer in 2015 than it was in the period 1890-1910.

Additionally, some 0.3°C warming had already taken place by the year 1900, as discussed in an earlier post.

Together, that makes that 2015 temperatures were 1.47°C above pre-industrial levels.

Furthermore, temperatures did rise steeply over the course of the year 2015.

By the end of the year 2015, the temperature rise was even stronger than the average for 2015 would indicate, as illustrated by the image on the right.

It is now 2016 and temperatures are still rising. In other words, it now is more than 1.5°C or 2.7°F warmer than in pre-industrial times. In conclusion, we have already crossed the 1.5°C guardrail that the Paris Agreement had pledged to try and limit global warming to. 

What is the prognosis for the temperature rise from here onward? The current El Niño is expected to continue well into 2016. Even if the El Niño slows down, it will by then likely have contributed to huge losses of snow and ice cover, including sea ice melt in the Arctic. The resulting albedo changes alone may well have an even stronger warming effect than the El Niño, while there are further feedbacks such as disruption of the jet stream and methane eruptions from the seafloor of the Arctic Ocean.

The image below shows that, when that same trendline featuring in above graph is extended into the future, it points at a 2°C or 3.6°F global temperature anomaly rise before the year 2030, a rise of about 4°C or 7.2°F by 2040, and a 10°C or 18°F rise before the year 2060. That would be a rise compared to the period 1951-1980, i.e. warming compared to pre-industrial levels would be even more severe.


Three points are important to help more fully grasp the predicament we are in:
  1. At higher latitudes of the Northern Hemisphere, temperatures are rising faster than globally, as illustrated by above image that shows that a 10°C rise could hit the Arctic by 2030. 
  2. Summer peaks will be even more devastating than annual averages. 
  3. The rise of temperatures on land will be steeper than the rise in the combined land-ocean temperatures, as illustrated by the image below that shows that a 3°C rise on land could occur well before the year 2030.  


Comprehensive and effective action needed

As greenhouse gases and temperatures keep rising, the heat will be felt earliest and most severely on land, during the northern summer and in the Arctic.

One big danger is that soil that was previously frozen will become exposed and will start releasing huge amounts of carbon, in the form of carbon dioxide or methane.

Furthermore, boreal forest, tundra and peats bogs are at risk of firestorms that will also come with huge amounts of emissions.

All this will make the rise in temperature speed up even more, with much of the soot from firestorms in Siberia settling on the Himalaya Tibetan plateau, melting the glaciers there and causing short-term flooding followed by rapid decrease of the flow of ten of Asia’s largest river systems that originate there, with more than a billion people’s livelihoods depending on the continued flow of this water.

Again, the reason why temperatures look set to rise so abruptly and dramatically in the Arctic is feedbacks, as discussed as the feedbacks page. The biggest danger that comes with these rapidly rising temperatures in the Arctic is that large methane eruptions from the seafloor of the Arctic Ocean will further heat up the atmosphere, at first in hotspots over the Arctic, and eventually around the globe, while also causing huge temperature swings and extreme weather events, further contributing to increasing depletion of fresh water and food supply.

The situation is dire and calls for comprehensive and effective action, as described in the Climate Plan

Below is an image by Malcolm Light, which updates an image that appeared in an earlier post


Annual mean carbon dioxide level measured at Mauna Loa, Hawaii, grew by 3.17 ppm (parts per million) in 2015, a higher...
Posted by Sam Carana on Thursday, January 14, 2016

Friday, December 4, 2015

Ocean Heat Depth

Ocean heat at the equator


On November 24, 2015, equatorial waters at ≈100 m (328 ft) depth at 110-135°W were over 6°C (10.8°F) warmer than average in 1981-2000, as illustrated by above image. The animation below shows equatorial ocean heat over the past few months, illustrating that temperature anomalies greater than 6°C (10.8°F) occurred throughout this period at depths greater than 100 m (328 ft).

The danger of ocean heat destablizing clathrates in the Arctic

The danger is that ever warmer water will reach the seafloor of the Arctic Ocean and destabilize methane that is held there in sediments the form of free gas and hydrates.

So, how comparable is the situation at the equator with the situation in the Arctic? How much heating of the Arctic Ocean has taken place over the past few years?

The image on the right, produced with NOAA data, shows mean coastal sea surface temperatures of over 10°C (50°F) in some areas in the Arctic on August 22, 2007.

In shallow waters, heat can more easily reach the bottom of the sea. In 2007, strong polynya activity caused more summertime open water in the Laptev Sea, in turn causing more vertical mixing of the water column during storms in late 2007, according to this study, and bottom water temperatures on the mid-shelf increased by more than 3°C (5.4°F) compared to the long-term mean.

This study finds that drastic sea ice shrinkage causes increase in storm activities and deepening of the wind-wave-mixing layer down to depth ~50 m (164 ft) that enhance methane release from the water column to the atmosphere. Indeed, the danger is that heat will warm up sediments under the sea, containing methane in hydrates and as free gas, causing large amounts of this methane to escape rather abruptly into the atmosphere.

The image below, replotted by Leonid Yurganov from a study by Chepurin et al, shows sea water temperature at different depths in the Barents Sea, as described in an earlier post.


The image below is from a study published in Nature on November 24, 2013, showing water temperatures measurements taken in the Laptev Sea from 1999-2012.

Water temperatures in Laptev Sea. Red triangles: summer. Blue triangles: winter. Green squares: historic data.
From Shakhova et al., (2013) doi:10.1038/ngeo2007
Before drawing conclusions, let's examine some peculiarities of the Arctic Ocean more closely, specifically some special conditions in the Arctic that could lead to greater warming than elsewhere and feedbacks that could accelerate warming even more.

Amount of methane ready for release

Sediments underneath the Arctic Ocean hold vast amounts of methane. Just one part of the Arctic Ocean alone, the East Siberian Arctic Shelf (ESAS, rectangle on map below, from the methane page), holds up to 1700 Gt of methane. A sudden release of just 3% of this amount could add over 50 Gt of methane to the atmosphere, and experts consider such an amount to be ready for release at any time (see above image).


Total methane burden in the atmosphere now is 5 Gt. The 3 Gt that has been added since the 1750s accounts for almost half of the (net) total global warming caused by people. The amount of carbon stored in hydrates globally was in 1992 estimated to be 10,000 Gt (USGS), while a more recent estimate gives a figure of 63,400 Gt (Klauda & Sandler, 2005). The ESAS alone holds up to 1700 Gt of methane in the form of methane hydrates and free gas contained in sediments, of which 50 Gt is ready for abrupt release at any time.


Imagine what kind of devastation an extra 50 Gt of methane could cause. Imagine the warming that will take place if the methane in the atmosphere was suddenly multiplied by 11.

Whiteman et al. recently calculated that such an event would cause $60 trillion in damage. By comparison, the size of the world economy in 2012 was about $70 trillion.

Shallow waters in the Arctic Ocean
Shallow waters and little hydroxyl

The danger is particularly high in the shallow seas that are so prominent in the Arctic Ocean, as illustrated by the light blue areas on the image on the right, from an earlier post.

Much of the waters in the Arctic Ocean are less than 50 m deep. Being shallow makes waters prone to warm up quickly during summer temperature peaks, allowing heat to penetrate the seabed.

This can destabilize hydrates and methane rising through shallow waters will then also enter the atmosphere more quickly, as it rises abruptly and in plumes.

Elsewhere in the world, releases from hydrates underneath the seafloor will largely be oxidized by methanotroph bacteria in the water and where methane does enter the atmosphere, it will quickly be oxidized by hydroxyl. In shallow waters, however, methane released from the seabed will quickly pass through the water column.

Large abrupt releases will also quickly deplete the oxygen in the water, making it harder for bacteria to break down the methane.

Very little hydroxyl is present in the atmosphere over the poles, as illustrated by the image on the right, showing global hydroxyl levels, from an earlier post.

In case of a large abrupt methane release from the Arctic Ocean, the little hydroxyl that is present in the atmosphere over the Arctic will therefore be quickly depleted, and the methane will hang around for much longer locally than elsewhere on Earth.

Shallow waters make the Arctic Ocean more prone to methane releases, while low hydroxyl levels make that methane that enters the atmosphere in the Arctic will contribute significantly to local warming and threaten to trigger further methane releases.

High levels of insolation in summer in the Arctic

Furthermore, the amount of solar radiation received by the Arctic at the June Solstice is higher than anywhere else on Earth, as illustrated by the image below, showing insolation on the Northern Hemisphere by month and latitude, in Watt per square meter, from an earlier post.

Warm water enters Arctic Ocean from Atlantic and Pacific Oceans

What further makes the situation in the Arctic particularly dangerous is that waters are not merely warmed up from the top down by sunlight that is especially strong over the Arctic Ocean in summer on the Northern Hemisphere, but also by warm water that flows into the Arctic Ocean from rivers and by warm water that enters the Arctic Ocean through the Bering Strait and through the North Atlantic Ocean. The latter danger is illustrated by the image below, from an earlier post.


Feedbacks

Furthermore, there are feedbacks that can rapidly accelerate warming in the Arctic, such as albedo losses due to loss of sea ice and snow cover on land, and changes to the jet stream resulting in more extreme weather. These feedbacks, described in more details at this page, are depicted in the image below.


Methane


Above image shows that methane levels on December 3, 2015, were as high as 2445 parts per billion (ppb) at 469 millibars, which corresponds to an altitude of 19,810 feet or 6,041 m.

The solid magenta-colored areas (levels over 1950 ppb) that show up over a large part of the Arctic Ocean indicate very strong methane releases.

Note there are many grey areas on above image. These are areas where no measurements could be taken, which is likely due to the strength of winds, rain, clouds and the jet stream, as also illustrated by the more recent (December 5, 2015) images on the right.

The polar jet stream on the Northern Hemisphere shows great strength, with speeds as high as 243 mph or 391 km/h (over a location over japan marked by green circle) on December 5, 2015.

So, high methane levels may well have been present in these grey areas, but didn't show up due to the weather conditions of the moment.

Furthermore, the white geometric areas are due the way the satellite takes measurements, resulting in areas that are not covered.

Finally, it should be noted that much of the methane will have been broken down in the water, before entering the atmosphere, so what shows up in the atmosphere over the Arctic is only part of the total amount of methane that is released from the seafloor.

In conclusion, the high methane levels showing up over the Arctic indicate strong methane releases from the seafloor due to warm waters destabilizing sediments that contain huge amounts of methane in the form of free gas and hydrates.

Climate Plan

As global warming continues, the risk increases that greater ocean heat will reach the Arctic Ocean and will cause methane to be released in large quantities from the Arctic Ocean seafloor. The 2015 El Niño has shown that a huge amounts of ocean heat can accumulate at a depth greater than 100 m (328 ft). Conditions in the Arctic and feedbacks make that methane threatens to be released there abruptly and in large quantities as warming continues.

The situation is dire and calls for comprehensive and effective action as described at the Climate Plan


On November 24, 2015, equatorial waters at ≈100 m (328 ft) depth at 110-135°W were over 6°C (10.8°F) warmer than average...
Posted by Sam Carana on Friday, December 4, 2015

Saturday, September 5, 2015

Methane Monster II ~ Demise of the Arctic


Presentation by Jennifer Hynes on runaway feedbacks in the Arctic and the resulting threat of near-term human extinction. At youtube.com/watch?t=309&v=L19JBY0kNmo


There are links to the transcript and to the complete set of slides of the presentation at Jennifer Hynes' blog.

In case you are looking for the earlier presentation by Jennifer Hynes, called 'The Arctic Methane Monster's Rapid Rise', it's at youtube.com/watch?v=a9PshoYtoxo and is also displayed below.


Methane Monster II ~ Demise of the Arctic by Jennifer Hynes http://arctic-news.blogspot.com/2015/09/methane-monster-2-demise-of-the-arctic.html
Posted by Sam Carana on Saturday, September 5, 2015

Tuesday, February 3, 2015

Watch where the wind blows

The Arctic looks set to be pummeled by strong winds on February 5, 2015, as shown by the Climate Reanalyzer forecast below.


The video below, based on Climate Reanalyzer images, watch the situation unfold over a period of 9 days


Strong winds can increase the transport of warm water into the Arctic Ocean by the Gulf Stream. The video shows strong winds repeatedly developing off the North American east coast and moving along the path of the Gulf Stream, all the way into the Arctic Ocean, all in a matter of days.

Emissions are causing greater warming of the Gulf Stream and the Arctic. As a result, there is less temperature difference between the equator and the Arctic, slowing down the speed at which the jet streams circumnavigate the globe, while the jets can also become wavier, which in turn can cause extreme weather events.

In this case, what fuels these winds is the temperature difference between an area off the east coast of North America where temperatures are much higher than they used to be on the one hand, and an area in Siberia where temperatures are extremely low on the other hand. Wind flows from a warm area to a cold area, and the greater the temperature difference, the stronger the wind will blow.

The image below shows that, on February 3rd, 2015, a sea surface temperature of 21°C (69.8°F) was recorded off the east coast of North America (green circle), which constitutes a 12°C (21.6°F) anomaly. Anomalies as high as 12°C were also recorded on February 4, 2015.

click on image to enlarge
Changes to the jet streams can thus fuel strong winds, and such winds can bring warmer air into the atmosphere over the Arctic Ocean. On February 5, 2015, surface temperatures over a large part of the Arctic Ocean were more than 20°C (36°F) warmer compared to what they were from 1985 to 1996.


Extreme weather events, as a result of changes to the jet streams and polar vortex, are depicted as feedback #19 in the diagram below, while storms that bring warmer air into the atmosphere over the Arctic Ocean are depicted as feedback #5,

Besides increasing the transport of warm water into the Arctic Ocean and bringing warmer air into the atmosphere over the Arctic Ocean, strong winds can also break up the sea ice by sheer brute force of the waves caused by the wind.

Waves as high as 10.61 m (34.81 ft) were recorded south of Greenland on February 4, 2015, while waves as high as 7.05 m (23.13 ft) were recorded on the edge of the Arctic sea ice (east of Svalbard) on February 5, 2015, as shown on the combination image below.


Waves that break up the sea ice into smaller pieces can speed up melting, especially in summer. More wind also means more water evaporation, and warmer air holds more water vapor, so this can result in huge rainstorms that can rapidly devastate the integrity of the ice. Strong winds thus constitute a feedback that can result in more open waters in the Arctic Ocean (feedback #6 on the diagram below).

Furthermore, strong winds can speed up the currents that will eventually move sea ice out of the Arctic Ocean into the Atlantic Ocean (feedback #7). Wavy waters catch more sunlight than still water (feedback #8). Decline of the Arctic snow and ice cover results in more sunlight being absorbed by the Arctic, thus further heating up the water of the Arctic ocean (feedback #1).

The dual image below, with images from Climate Reanalyzer, shows high sea surface temperatures around North America and at the edges of the Arctic sea ice. This contributes to surface temperatures that are 20°C (36 °F) higher than what they used to be in Eastern Siberia. At the same time, temperatures on land elsewhere in Siberia, on the North Pole and in parts of Canada and Greenland can go down to 40 degrees below zero.


Accelerated warming of the Arctic is changing the jet streams, in turn contributing to the likelyhood that such strong winds will hit the Arctic. The high temperature difference between the hot spot off the North American east coast and the cold spot over Siberia fuels such strong winds. The dual images below show the jet stream's elongated path over Greenland. Accordingly, temperature anomalies in Greenland are reaching the top end of the scale.


The big danger is that such strong winds will warm up the Arctic Ocean and cause huge amounts of methane to erupt from its seafloor.

The image below shows that methane levels as high as 2503 ppb were recorded on January 31, 2015.


Such methane eruptions constitute yet another feedback that further contributes to warming in the Arctic. For more feedbacks, see the image below.

from:  climateplan.blogspot.com/p/feedbacks.html

The situation is dire and calls for comprehensive and effective action, as discussed at the Climate Plan blog.


Sunday, November 30, 2014

Another Heatwave Hits Arctic

As parts of Canada, Greenland and Russia are hit by -40 degrees temperatures (anomalies at the bottom end of the scale), parts of the Arctic are experiencing temperatures above freezing (anomalies at the top end of the scale), as illustrated by the image below.

[ click on image to enlarge ]
Temperatures in the Arctic are much higher than they used to be and this situation further accelerates warming in the Arctic, due to a number of feedbacks.

One such feedbacks has been coined the ‘open doors feedback’. Indeed, the situation is much like leaving the fridge door open. This allows cold air to more easily move out of the fridge, i.e. the Arctic, resulting in the cold temperatures over North America that have received extensive news coverage in the media. At the same time, warm air can move more easily into the fridge, i.e. the Arctic, and this is one of the reasons why the Arctic is hit by temperatures that are so much higher than what used to be normal.

The situation has been described in a number of earlier posts such as this one, as well in a recent interview with Jennifer Francis. As the Arctic warms more rapidly than the rest of the world, there's less temperature difference between the Arctic and the equator, resulting in the jet stream going around the globe at a lower speed with more elongated loops.

The left chart on above image shows such an elongated loop going north along the east coast of Greenland, then bending before Scandinavia and moving over the north of Greenland, then going around the North Pole and moving back to Scandinavia. This loop is not very visible on the chart, because the jet stream moves faster along straight tracks, and this chart highlights wind speed more than it highlights the path of the jet stream. Yet, the shape of this loop is very important, as it traps warmer air north of Greenland.

BTW, a weaker jet stream also elevates the chance of heat waves elsewhere, which can indirectly warm up the Arctic. Examples of this are heat waves over the Gulf Stream as it crosses the Atlantic Ocean, resulting in warmer water being carried into the Arctic Ocean, and heat waves over Siberia and North America, resulting in warming up of rivers that end in the Arctic Ocean.

Anyway, to get back to the current heatwave, there are a number of reasons why temperatures in the Arctic are so high at the moment. One of the biggest reasons is ocean heat, which has reached very high levels, especially in the North Atlantic, while the Gulf Stream keeps transporting warmer water from the North Atlantic into the Arctic Ocean (i.e. water that is warmer than the water in the Arctic Ocean). This warms up the seafloor of the Arctic Ocean, resulting in methane erupting from the seafloor, with a strong immediate local warming impact in the Arctic, thus further accelerating warming in the Arctic in another one of these self-reinforcing feedback loops, as pictured in the image below.


Further feedbacks that accelerate warming in the Arctic are discussed at the feedbacks page.

Without effective and comprehensive action, these feedbacks threaten to lead to runaway warming, i.e. abrupt climate change causing mass death and destruction, and resulting in extinction at massive scale, as depicted in the image below and as described in this earlier post.


In conclusion, the situation is dire and calls for comprehensive and effective action, as discussed at the Climate Plan blog.